For several reasons I have been loading up on mobile for the past 12 months. I had been involved in some mobile projects a couple of years ago and then for some reason it seemed to go into a an halt, because we didn’t do a lot of mobile (I guess there was little market demand) but that changed since the beginning of 2011 it seems like this is it.
If you are around of this internet thing for as long as me, you have surely heard, several times, year after year, that this would be the year of the mobile. Whatever that means, I still don’t know if this will be the year of the mobile, but, I know there is finally strong market demand for all things mobile. There are a lot of reasons contributing to this evolution: improved device capabilities, fairly priced data plans, price drop for smartphones (namely Android), user need to stay connected away from the desktop, just to name a few.
Of course the way each company can take advantage of mobile is very different and I have devoted quite a bite of my time to go through that and understand the mobile challenges companies are facing. Mobile isn’t the same for a retail company as it is for a newspaper or even a service like Gmail or Facebook, and there is a lot to learn on that field.
I will post below some charts stolen from the “comScore 2012 Mobile Future in Focus” whitepaper that I find interesting. Please beware that there are both charts for the US and EU5 (France, Germany, Italy, Spain, and UK) for some of the topics.
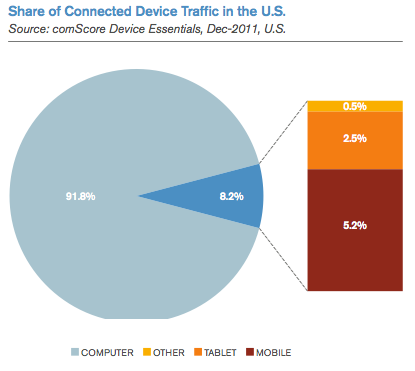
Traffic share by device type (US)
Interesting to see that less than 10% of traffic is generated on mobile devices. It might be because heavy media consumption (read: video) is still the land of the desktop.
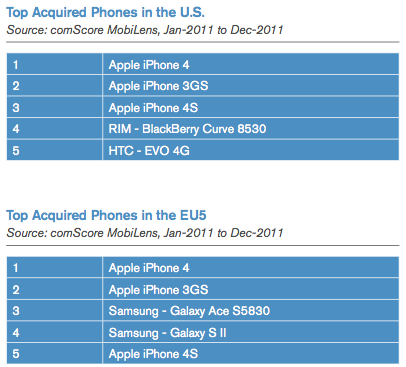
- Top selling smartphones (EU5 vs US)
I would highlight the superior EU5 market maturity since they have gotten rid of BB and they adopted Android with Samsung. It is also interesting to notice that Samsung places a middle level equipment and also it’s Galaxy top end smartphone on the list.

Smartphone share evolution (EU vs US)
This one is expected and proves the strong advance of smartphones on the mobile arena.
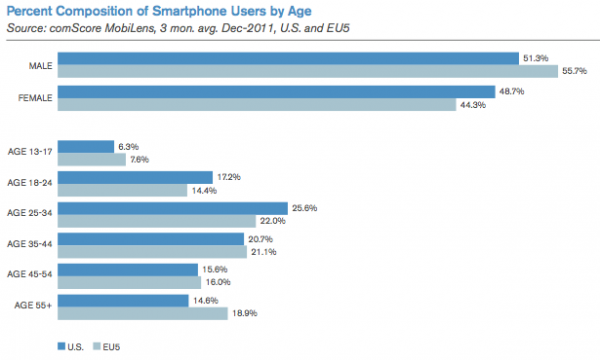
Smartphone users by gender and age (EU vs US)
The adoption on the 25/44 would suggest either a business usage pattern or the higher equipment costs. Or maybe it’s both but with Android bringing cheaper smartphones the latter will soon be irrelevant.
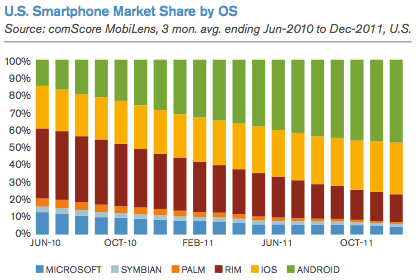
This chart show the market share by OS and it is interesting to see that although the Android is obviously the stronger player, IOS was also able to grow it’s market share by eating RIM and Nokia’s lunch on the last months.
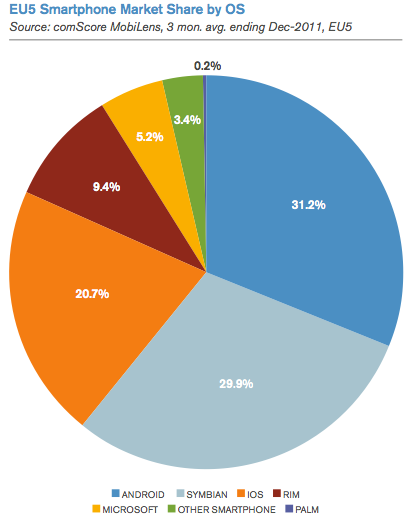
Smartphone market share by OS (EU)
Nokia is still accounting for nearly 30% of smartphones, meaning Android and IOS still have lots of room to grow in the EU.
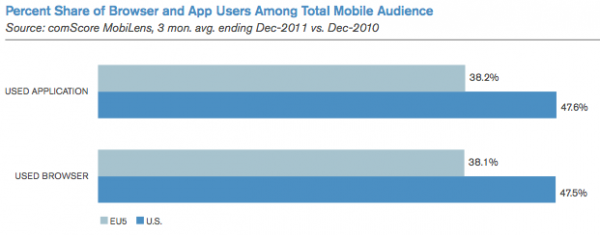
Mobile Web vs Apps (EU5 vs US)
As the users become more dependent on their smartphones, both mobile web and app usage grows over time. It would also be safe to say that there are more mobile-ready/optimized websites and also more and more apps to support this trend.
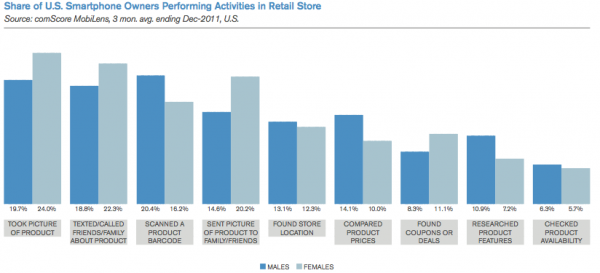
Smartphone activities at retail stores (US)
And now for something very real: mobile phone usage and smartphone specific usage inside retail stores. Even if there are lots of retailers still not caring about mobile, users find multiple uses for their devices while at the store (I believe all smartphone specific usage like price/product comparison, coupons/deals and product research can only go stronger).
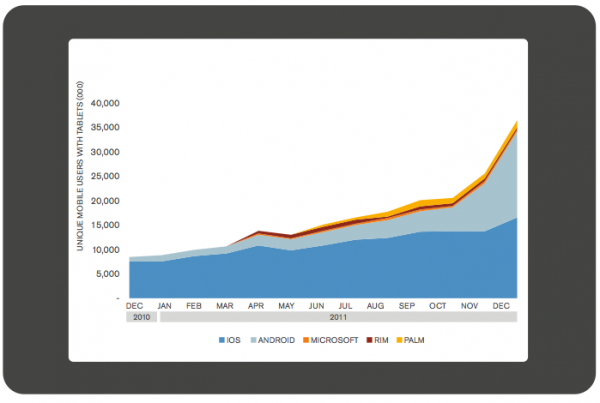
Tablet users by OS (US)
And now for the tablets, or should we say iPad’s? Well no. Just like with the smartphone market, IOS made the revolution but Android is getting stronger by the day, even if I suspect the Android tablet growth is somewhat slower in the EU.
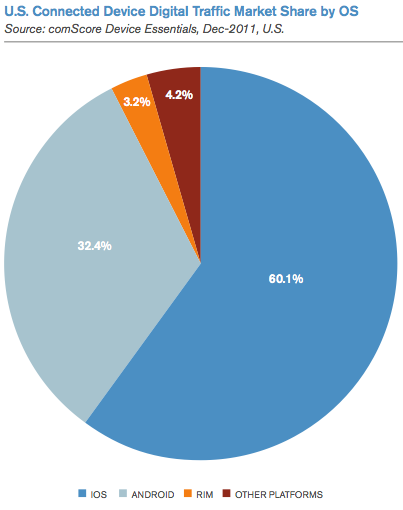
Mobile traffic by OS (US)
It seems like IOS is the most data hungry device. From my personal experience I can see why, but on the other hand I can seem to get around with a fairly limited data plan, so I’m curious to know how this chart would translate into Gb.
